

Everybody has the same reaction at the same bend in the road. Mine was wrong for about fifteen years.
You come east out of the Inland Empire and the land squeezes. San Jacinto on your right, San Gorgonio on your left, both over ten thousand feet, the highway threading the slot between them. Air gets funneled through that slot and dumped into the desert. Most afternoons. Most of the year. That is the entire reason anything got built here.
Round the bend at Whitewater and the turbines are just there. Up the ridges, out across the flats, scattered along the alluvial fans. Some spinning hard. Some dead still. A few obviously dead and left standing anyway, which nobody ever mentions in the brochure.
It is the only place I know where you can see the grid. Normally the grid hides in conduit and easements and somebody’s substation behind a chain-link fence. Here it is on a hillside, moving, forty miles of it.
And the thought that arrives, every time, is: that is a lot of power.
It is not.
Four decades of turbines, and the number nobody quotes
San Gorgonio Pass holds about 667 MW across roughly 667 turbines. The match is a coincidence, not a ratio, and I mention it only because it will stick in your head better than either number alone. Third-largest wind resource in California, behind Kern County’s 3,254 MW and Solano’s 1,031.
It is also not a wind farm. It is about twenty-five separate projects, different owners, different vintages, different contracts, which is why you cannot pull its output the way you pull a plant’s. First turbines went up around 1982. At the 1987 peak there were more than 4,200 of them, small and fast and genuinely loud. By December 2021, about 1,220. Today, about 667.
That collapse is the good news. It is repowering, and the trade is brutal in the right direction.
FIGURE 1 ·
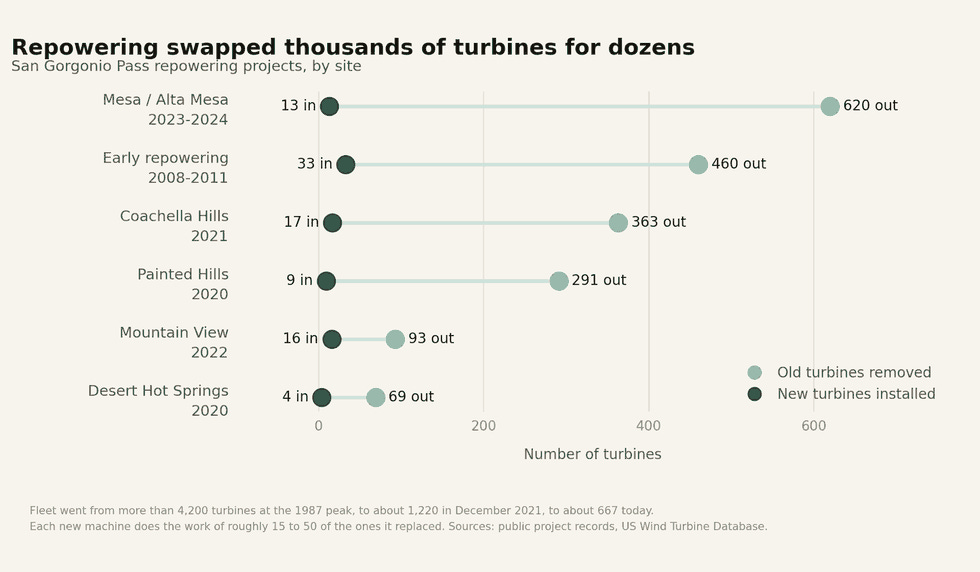
Repowering swapped thousands of turbines for dozens.
Six hundred twenty machines came off Mesa and Alta Mesa in 2023 and 2024. Thirteen went back on. Coachella Hills gave up 363 for 17. Every new turbine eats fifteen to fifty of the ones it replaced, and the hillside empties out a little more each time. This is what actual progress looks like in hardware, and it took forty years.
Now the number nobody puts on the postcard. Apply California’s 2024 fleet-wide wind capacity factor, about 29%, to 667 MW. You get roughly 1,700 GWh a year. Be generous with that, because the pass is an old site in a worse wind class than Tehachapi, so the real figure probably sits under it.
Four decades. Four thousand turbines up, three thousand down. Seventeen hundred gigawatt-hours.
Hold that number.
Forty miles down the road, somebody ran the same math
Keep driving. The road drops the whole way. Date palms, then table grapes, then the valley floor hits sea level and keeps going.
At 52nd and Fillmore in the city of Coachella, a Riverside developer called Stronghold Power Systems drew up the Coachella Valley Technology Campus. Six buildings, three million square feet, somewhere between 240 and 450 acres of working farmland depending on which version of the plan you read. Phase one at 270 to 300 MW. Full buildout at 600.
Run 270 MW at an 85% load factor and you get about 2,010 GWh a year.
Phase one. One phase, of one campus, would have eaten more electricity than every turbine in the pass produces.
FIGURE 2 ·
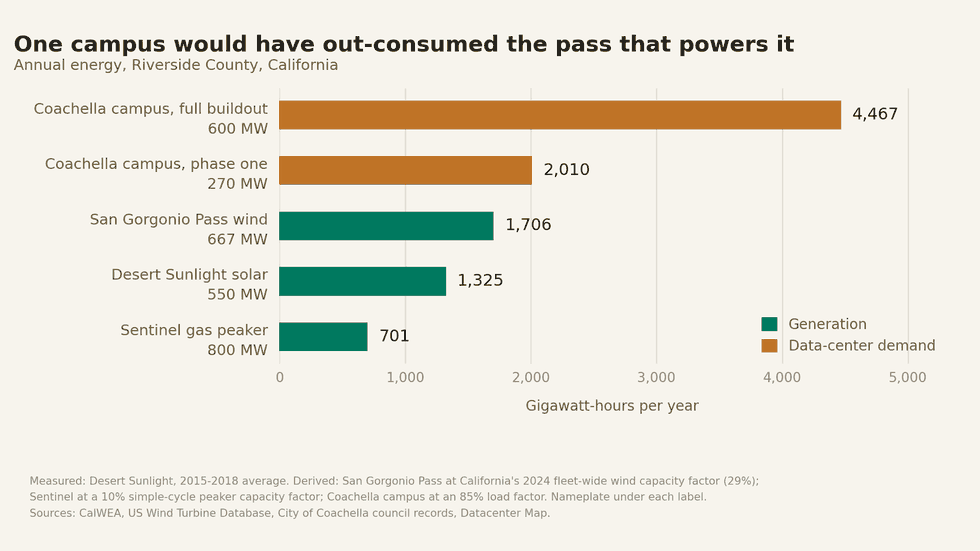
One campus would have out-consumed the pass that powers it.
At full buildout it is 4,470 GWh, which beats the pass, the 550 MW Desert Sunlight solar farm, and the 800 MW Sentinel gas peaker put together.
Look at Sentinel for a second. Eight hundred megawatts of nameplate, more than the wind farm, and it produces a fraction of the energy, because it is a peaker and sitting idle is its job. Nameplate is a promise. Output is what showed up. People conflate those two constantly, usually on purpose, and one drive through this valley cures you of it permanently.
FIGURE 3 ·
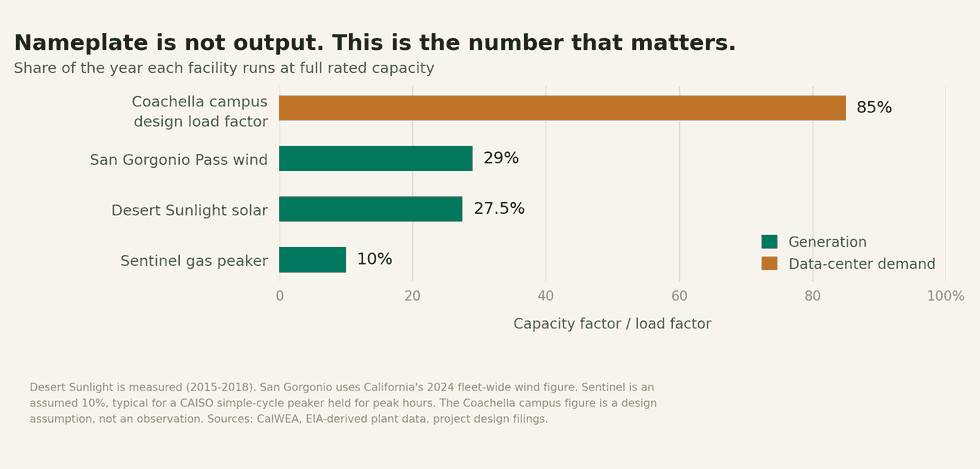
A wind farm runs flat out less than a third of the year. A data center runs flat out almost all of it.
That gap is the whole business. Wind is free. Turning wind into electricity on a schedule somebody else chose is not free, and those are different problems that get filed under the same word.
Here is the detail that should stick with you, though. The campus was barely going to touch the grid. Fuel cells, battery storage, diesel for emergencies, hanging off Imperial Irrigation District distribution, and in February the city signed an agreement to stand up its own municipal electric utility around the thing. The load was going to show up carrying its own generator, on land that currently grows food, in a valley whose entire public identity is those turbines back at the pass.
Then the city killed it
June 6, the council passed a 45-day moratorium, told staff to draft a permanent ban, and tore up the utility agreement. July 9, they stretched the moratorium to ten and a half months. First reading August 12. Second reading August 26. Done.
The ordinance kills large-scale AI data centers citywide and leaves small telecom and storage facilities alone. Stronghold’s CEO said phase one would have thrown off about $54 million a year in public revenue, schools and water district included. The mayor said it came from the will of the people. Both of those are probably true, which is the uncomfortable part.
Coachella is the second California city to ban data centers outright. Monterey Park got there first, by ballot, in June. Ten or so California cities now have a moratorium or a ban on the books, and that list includes Desert Hot Springs and Indio. Three cities in this one valley have said no. Perris, up in the Inland Empire proper, is thinking about it.
The constraint moved and nobody updated the model
For twenty years the story of new load out west has been the interconnection queue. Get in line. Wait for the study. Wait for the upgrade. Wait for somebody to build the transmission you need. Every consultant deck ends there.
Stronghold designed around all of it. Fuel cells, batteries, its own utility, its own distribution deal. It did precisely the thing everyone in this industry says developers ought to do, which is bring your own power and stop making the grid your problem.
Lost anyway. In a room with a hundred people in it, on a land-use vote, forty miles from the biggest pile of renewable generation in Southern California.
The California Energy Commission expects data center load on the CAISO grid to climb 1.8 GW by 2030 and 4.9 GW by 2040. That demand is real and it has to physically land on dirt somewhere.
FIGURE 4 ·
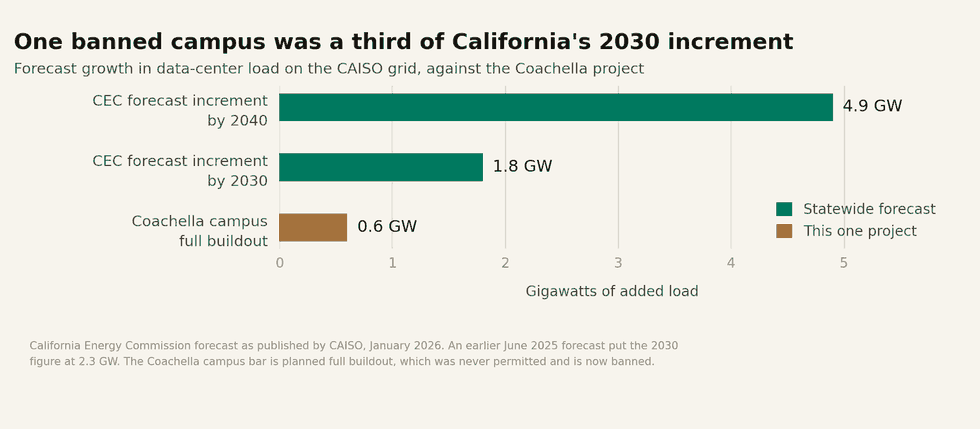
One banned campus was a third of California’s entire 2030 data-center increment.
So the question stopped being can we get power to this parcel. It is now will the people who live near this parcel let us. Different question, different clock, and it fails in ways you cannot model off a tariff. You can win every technical argument in the CAISO stack and still lose on a Wednesday night to a neighborhood petition that picked up 689 signatures in five days.
Nobody’s siting model has a field for that.
Drive it yourself if you get the chance. Forty-four years of turbines at one end of the valley. At the other end, a city that just told 600 MW to go be somebody else’s problem.
Where Stronghold lands next. Banned projects do not evaporate, they relocate. Watch unincorporated Riverside County and the Imperial Valley, which has its own fight and its own moratorium history.
Perris. It is weighing a restriction, and it matters more than Coachella did. I-215, warehouse stock, existing substations, a labor base. It was always the better site. If the ban pattern jumps from desert resort towns to the logistics corridor, California’s siting map gets small in a hurry.
Whether bring-your-own-generation survives contact. Behind-the-meter gas and fuel cells are the industry’s answer to interconnection delay. Coachella is the first clean test of that answer against an objection that was never about the grid.
Sources: CalWEA California wind fast facts (2024 figures, US Wind Turbine Database compilation, March 2026); San Gorgonio Pass repowering and turbine counts per public project records; Desert Sunlight Solar Farm reported generation, 2015 to 2018; CPV Sentinel Energy Project design specifications; City of Coachella council actions of June 6, July 9, August 12 and August 26, 2026, and the February 2026 municipal utility development agreement; contemporaneous KVCR, NBC Palm Springs, KESQ and Patch reporting; Datacenter Map project listing; California Energy Commission data center load forecast as published by CAISO, January 2026. Annual energy figures for San Gorgonio Pass, Sentinel and the Coachella campus are derived from nameplate capacity and stated capacity or load factors, not metered output.
Dynawatt is an independent brief compiled from public sources (ISO/RTO interconnection queues, FERC notices (Federal Register), ERCOT Large Load Working Group, PJM stakeholder committees, NRC ADAMS (reactor licensing), and DOE Loan Programs Office / EDF announcements). It is informational, non-advocacy, and not investment advice.